Python for Salesforce: List unique values found across similar Salesforce fields
31 Jan 2019
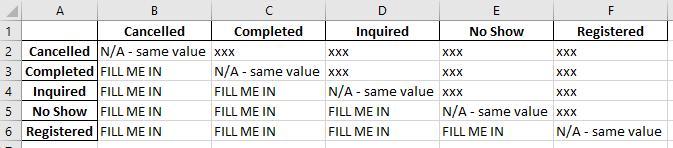
Table of Contents
Salesforce SOQL’s SELECT...COUNT...GROUP BY works great to find unique values present in a single field, but what if you have 50 nearly-identical fields and want to find unique values used in any of them? Python to the rescue – read on!
My Problem
I know it’s a strange data model, but in a Salesforce org I manage, we have over 50 custom fields that start with the word “Status,” one per program that we offer.
When it comes time to deduplicate Contact fields, sometimes for a given program, there are conflicting values. Our student workers who do deduplication need a clear guide about which value trumps which.
So, before sending an email to the business unit that requested these fields asking them to write this guide, I wanted to know what values were in use among these fields.
I also wanted to give them a “chart” they could fill in, like one of those city-distance charts in the back of a road atlas, indicating which value should “win” for every possible combination of values (I figured this would help them avoid accidentally forgetting to pick a “winner” for each value-pairing).
- In today’s examples, there are merely 6 custom fields and only 5 values are found among them.
- In my real-life org, there were over 50 custom fields and over 20 unique values found among them, across all 100,000+ Contacts.
That’s 5 million cells I analyzed in a split second, looking for the 20 unique values found among them!
Note that if I’d been looking for unique values within a single custom field, such as StatusProgram01__c, I could have found what I was looking for natively in Salesforce with SOQL:
SELECT StatusProgram01__c
FROM Contact
WHERE StatusProgram01__c != NULL
GROUP BY StatusProgram01__c
ORDER BY StatusProgram01__c
It’s the fact that I wanted to “vertically stack” / “concatenate” the contents of 50+ custom fields and then filter for uniqueness that made me need to export every row in my Contacts table to CSV and parse the CSV file with Python.
Step 1: Export my data from Salesforce
- Go to https://workbench.developerforce.com/query.php
- Object: Contact
- Fields: Pick all that begin with “Status”
- The resulting query is:
SELECT StatusProgram01__c,StatusProgram02__c, StatusProgram03__c,StatusProgram04__c, StatusProgram05__c,StatusProgram06__c FROM Contact - View as: Bulk CSV
- Click the “Query” button
- Under “Batches,” when “Status” becomes “Completed”, click the download icon (
 ) to the left of the word “Id”
 - Save it to my hard drive at
c:\example\allcs_statusfields.csv
Note: The Python code below would work just as well if I had simply exported all rows + all columns, and if I had instead used Data Loader to do the export.
(I exported with Workbench because it lists my fields in alphabetical order when building my SOQL query.)
However, I would need to modify my code to look for “STATUS” and “__C” when building the contents of “statusColNames” instead of “Status” and “__c,” since Data Loader exports column names in all-caps.
Step 2 (Python): Verify total row count, column count, & “Status…” column count before proceeding
Before proceeding, I want to make sure I didn’t download my data wrong – I’ll look at total row count, total column count, and “total count of columns that start with ‘Status’” before I move on to make sure I don’t see any surprises.
(I know my data, so this is all I need as verification.)
Python code
import pandas
df = pandas.read_csv('c:\\example\\allcs_statusfields.csv', dtype=object)

print(len(df))
print(len(df.columns))
statusColNames = [x for x in df.columns if x.startswith('Status') and x.endswith('__c')]
print(len(statusColNames))
Output
103829
6
6
Step 3 (Python): List & count unique values found
Python code
import pandas
df = pandas.read_csv('c:\\example\\allcs_statusfields.csv', dtype=object)
statusColNames = [x for x in df.columns if x.startswith('Status') and x.endswith('__c')]

valuesUsed = sorted(df[statusColNames].stack().unique(), key=lambda x: x.lower()) # Quick check of unique values present
print(valuesUsed)
print()
print(len(valuesUsed))
Output
['Cancelled','Completed','Inquired','No Show','Registered']

5
How it works
Note: sorted(df[statusColNames].stack().unique() is the heart of our code.
df[statusColNames]pulls a sub-table of our CSV file that only includes the column names that start with “Status” and end with “__c.”- In our case, that’s all of them, but I promised you this would work even if you exported extra columns from Salesforce.
.stack()is a function that all “Pandas DataFrame”-typed data in Python has. It means:
“Take every column in this table and concatenate them into one big column, deleting any cells with a blank/null value.“
(Note: the “data type” of the output of that operation is called a “Pandas Series.”).unique()is a function that all “Pandas Series”-typed data in Python has. It means:
“Give me a listing of every unique value found in this column.“sorted(...)is a function that all list-like data can be put within in Python. It means what it sounds like!
In this case, we gave it a little extra setting,, key=lambda x: x.lower(), which made sure it sorted things case-insensitively.
Its output is a plain-old Python list (which gets displayed as a comma-separated listing between square brackets).- Finally, we saved this “plain-old Python list” into a “variable” I decided to call “
valuesUsed.”
You’ll see later that we can refer to this list in our code by the name “valuesUsed.”
Step 4 (Python): Create a “road atlas”-style CSV file of “value-found” “intersections”
Python code
import pandas
df = pandas.read_csv('c:\\example\\allcs_statusfields.csv', dtype=object)
statusColNames = [x for x in df.columns if x.startswith('Status') and x.endswith('__c')]
valuesUsed = sorted(df[statusColNames].stack().unique(), key=lambda x: x.lower()) # Quick check of unique values present

df2 = pandas.DataFrame(columns=valuesUsed, index=valuesUsed)
alreadyDid = []
for x in valuesUsed:
    for y in valuesUsed:
        if x == y:
            df2[x][y] = 'N/A - same value'
        else:
            if (x,y) not in alreadyDid:
                df2[x][y] = 'FILL ME IN'
                alreadyDid.append((y,x))
            else:
                df2[x][y] = 'xxx'

df2.to_csv('c:\\example\\atlaschart.csv')
Contents of atlaschart.csv on my hard drive
| Cancelled | Completed | Inquired | No Show | Registered | |
|---|---|---|---|---|---|
| Cancelled | N/A - same value | xxx | xxx | xxx | xxx |
| Completed | FILL ME IN | N/A - same value | xxx | xxx | xxx |
| Inquired | FILL ME IN | FILL ME IN | N/A - same value | xxx | xxx |
| No Show | FILL ME IN | FILL ME IN | FILL ME IN | N/A - same value | xxx |
| Registered | FILL ME IN | FILL ME IN | FILL ME IN | FILL ME IN | N/A - same value |
How it works
The code I wrote to build this table might not be the most efficient way to do things, but any time you program, there’s more than one way to skin a cat, and I found this easy to write.
- I create an empty table (“Pandas DataFrame”) with the contents of
valuesUsedgoing across the top as columns and down the left as row IDs and call that table “df2”:df2 = pandas.DataFrame(columns=valuesUsed, index=valuesUsed) - I create an empty plain-old Python “list” and call it “
alreadyDid.” - I do a nested double loop through the contents of
valuesUsedso that I loop over all possible pairs of values (e.g. “Cancelled-Cancelled, Cancelled-Completed, Cancelled-Inquired…“). I call the first item in a pair “x” and the second “y.” - If
xandyare the same word, I jump to the cell ofdf2indicating the “intersection” of “Columnx” and “Rowy” and fill it in with the phrase “N/A - same value.” - Otherwise, I check to see if I’ve already seen this pairing of “x” & “y” before (because in this case, there’s no realistic difference between “Cancelled-Completed” and “Completed-Cancelled”) by checking if it’s in the “
alreadyDid” list. - If I haven’t seen this pair before, I jump to the cell of
df2indicating the “intersection” of “Columnx” and “Rowy” and fill it in with the phrase “FILL ME IN.”
Before moving on, I archive “x” & “y” into “alreadyDid”, only I flip them around as “y & x” so that when I get to them in reverse, the REVERSE values of “what I just did” will be in “alreadyDid.” - If I have done this pair of values before, I jump to the cell of
df2indicating the “intersection” of “Columnx” and “Rowy” and fill it in with the phrase “xxx” to indicate that it’s redundant.
As I said, this script chewed through 5,000,000 cells in a split second. Let me know if you use this code!
